Finding Debug Logs in LifterLMS
Debug logs help you understand what’s happening on your site when something breaks.
In LifterLMS, they’re mainly used to track down PHP errors and fatal issues that don’t appear on screen, especially during development or when troubleshooting plugin or theme conflicts.
A 500 error means something in your site’s code has failed. This can be caused by a plugin or theme conflict, a code error, or another issue that prevents WordPress from loading normally.
While the 500 error tells us that something is wrong, we need the specific error details to determine the source of the problem and help resolve it.
This guide walks you through turning debugging on safely, finding the logs WordPress creates, and switching debugging back off when you’re finished.
To enable debugging, you need to edit a configuration file on your server called wp-config.php. This file controls many of your site’s core settings.
Step 1: Access Your Site Files
You can’t edit wp-config.php from the WordPress dashboard, so you’ll need to use one of these methods instead:
- FTP Client: Use a tool like FileZilla to connect to your server.
- File Manager: Log in to your hosting account (e.g., cPanel, SiteGround, WP Engine) and open the File Manager.
Step 2: Locate and Edit wp-config.php
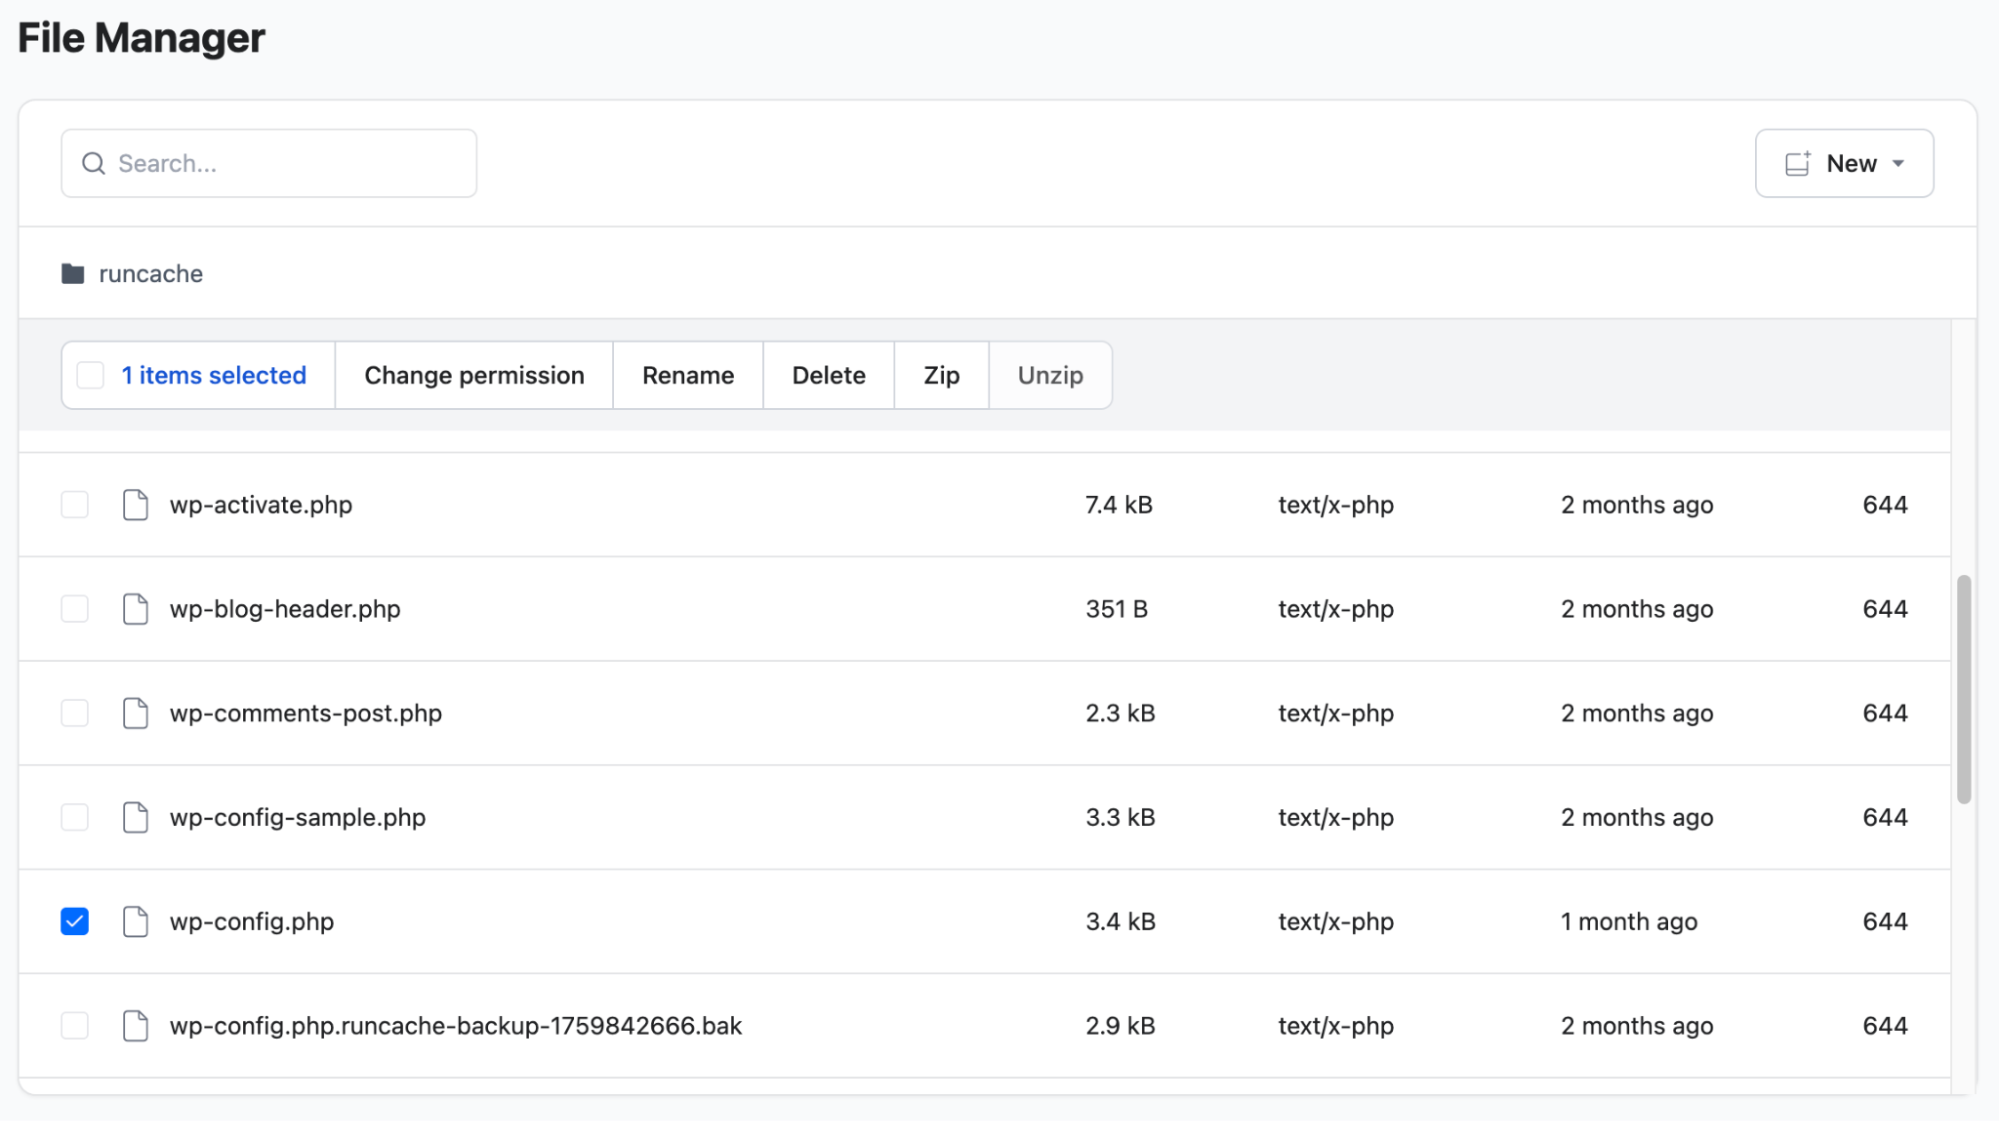
- In the main directory of your website, look for a file named wp-config.php.
- Before editing anything, download a copy of wp-config.php as a backup so you can restore it if something goes wrong.
- Right-click the file and select Edit.
Step 3: Add the Debug Code
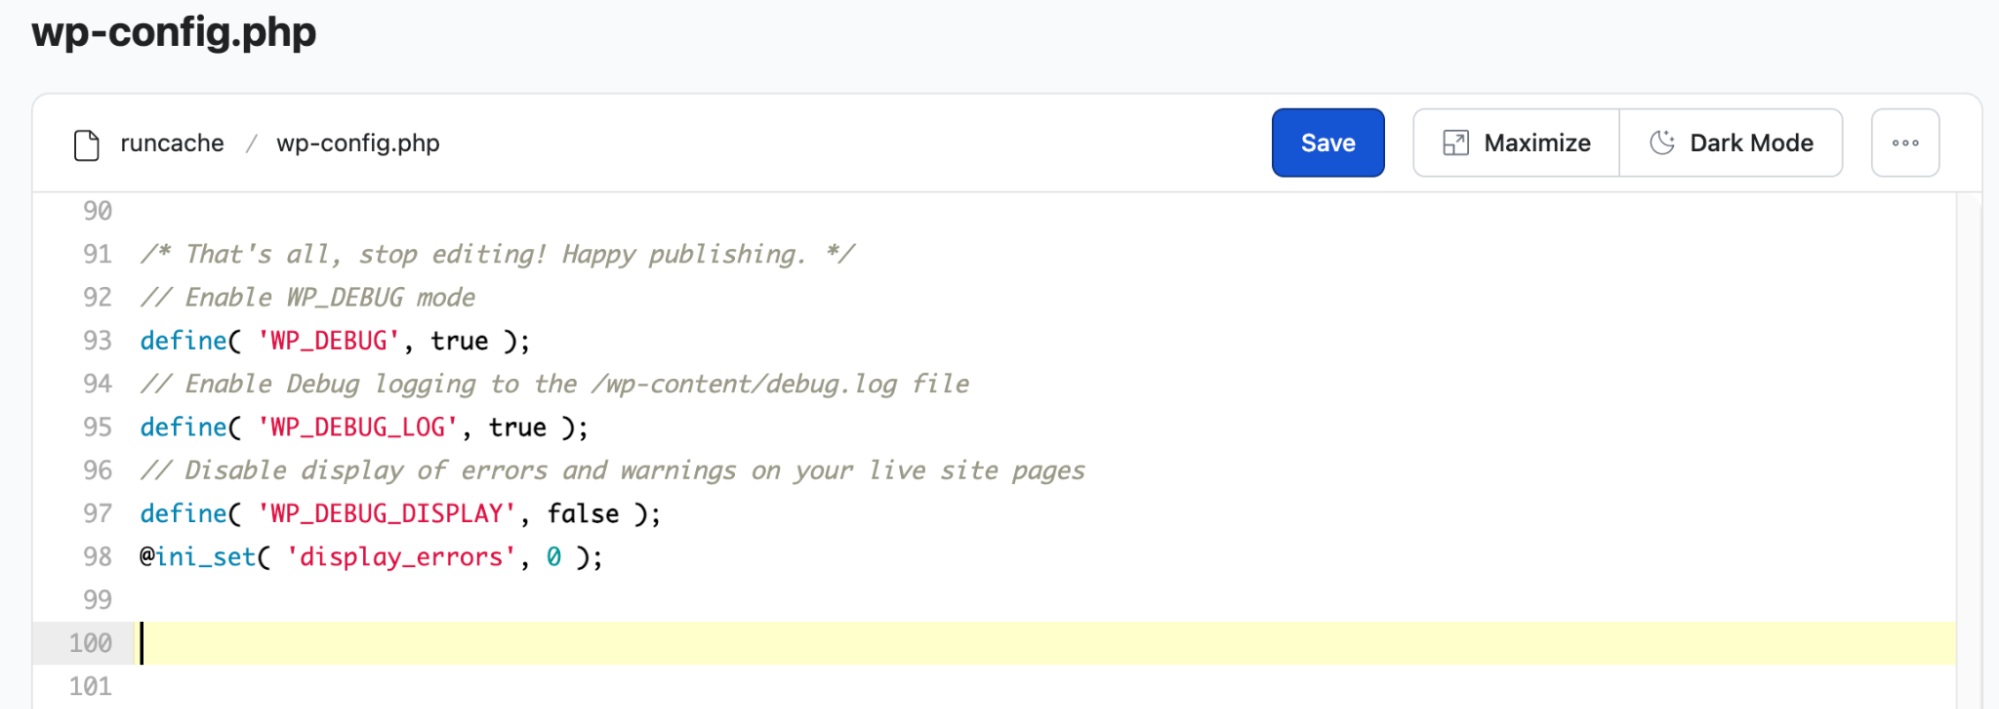
- Scroll down the file until you see the line:
/* That’s all, stop editing! Happy publishing. */ - If you see any WP_DEBUG lines already in the file, replace them with the versions shown below so all debug settings work together correctly.
- Copy and paste the following code block above the “stop editing” line:
// Enable WP_DEBUG mode
define( 'WP_DEBUG', true );
// Enable Debug logging to the /wp-content/debug.log file
define( 'WP_DEBUG_LOG', true );
// Disable display of errors and warnings on your live site
define( 'WP_DEBUG_DISPLAY', false );
@ini_set( 'display_errors', 0 );
- Save the file (and upload it back to the server if using FTP).
- WP_DEBUG: Switches on WordPress debugging.
- WP_DEBUG_LOG: Saves errors to a file called debug.log inside wp-content, so you can review them later.
- WP_DEBUG_DISPLAY: Hides error messages from visitors while still recording them in the log.
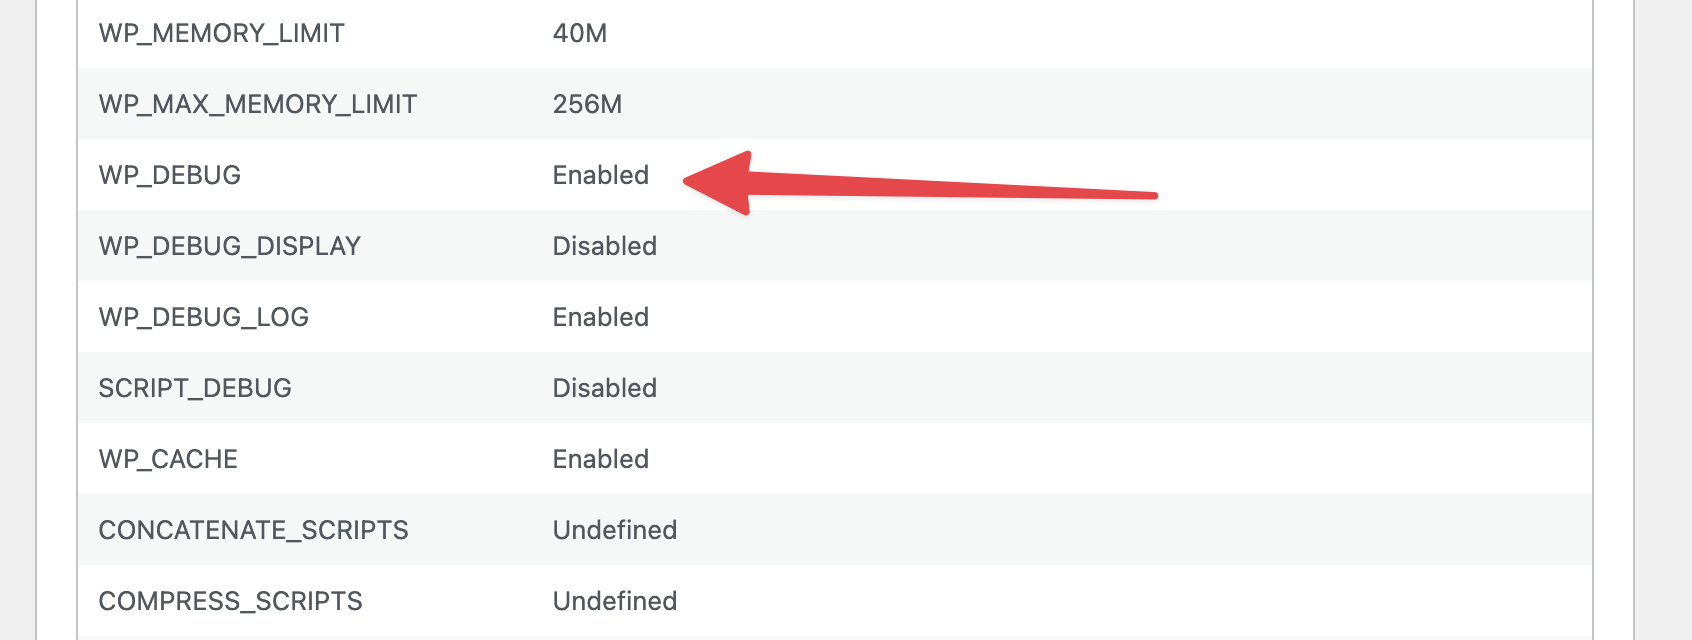
Once you’ve saved the file, you can confirm everything worked by going to Tools > Site Health > Info > WordPress Constants. This shows whether debugging is active.
After updating the configuration file, trigger the error again. Logs only record errors as they happen, so repeat the action that caused the issue to create a new log entry.
- Go back to your website.
- Perform the specific action that was causing the issue (e.g., saving a course, clicking a specific button, or reloading a white screen).
- Repeating the action will now add the error details to your debug log.
After you have triggered the error again, you can view the logs in one of two ways.
Method A: View via LifterLMS Settings (Easier)
If you can still access your WordPress dashboard, LifterLMS includes a built-in log viewer that simplifies this step.
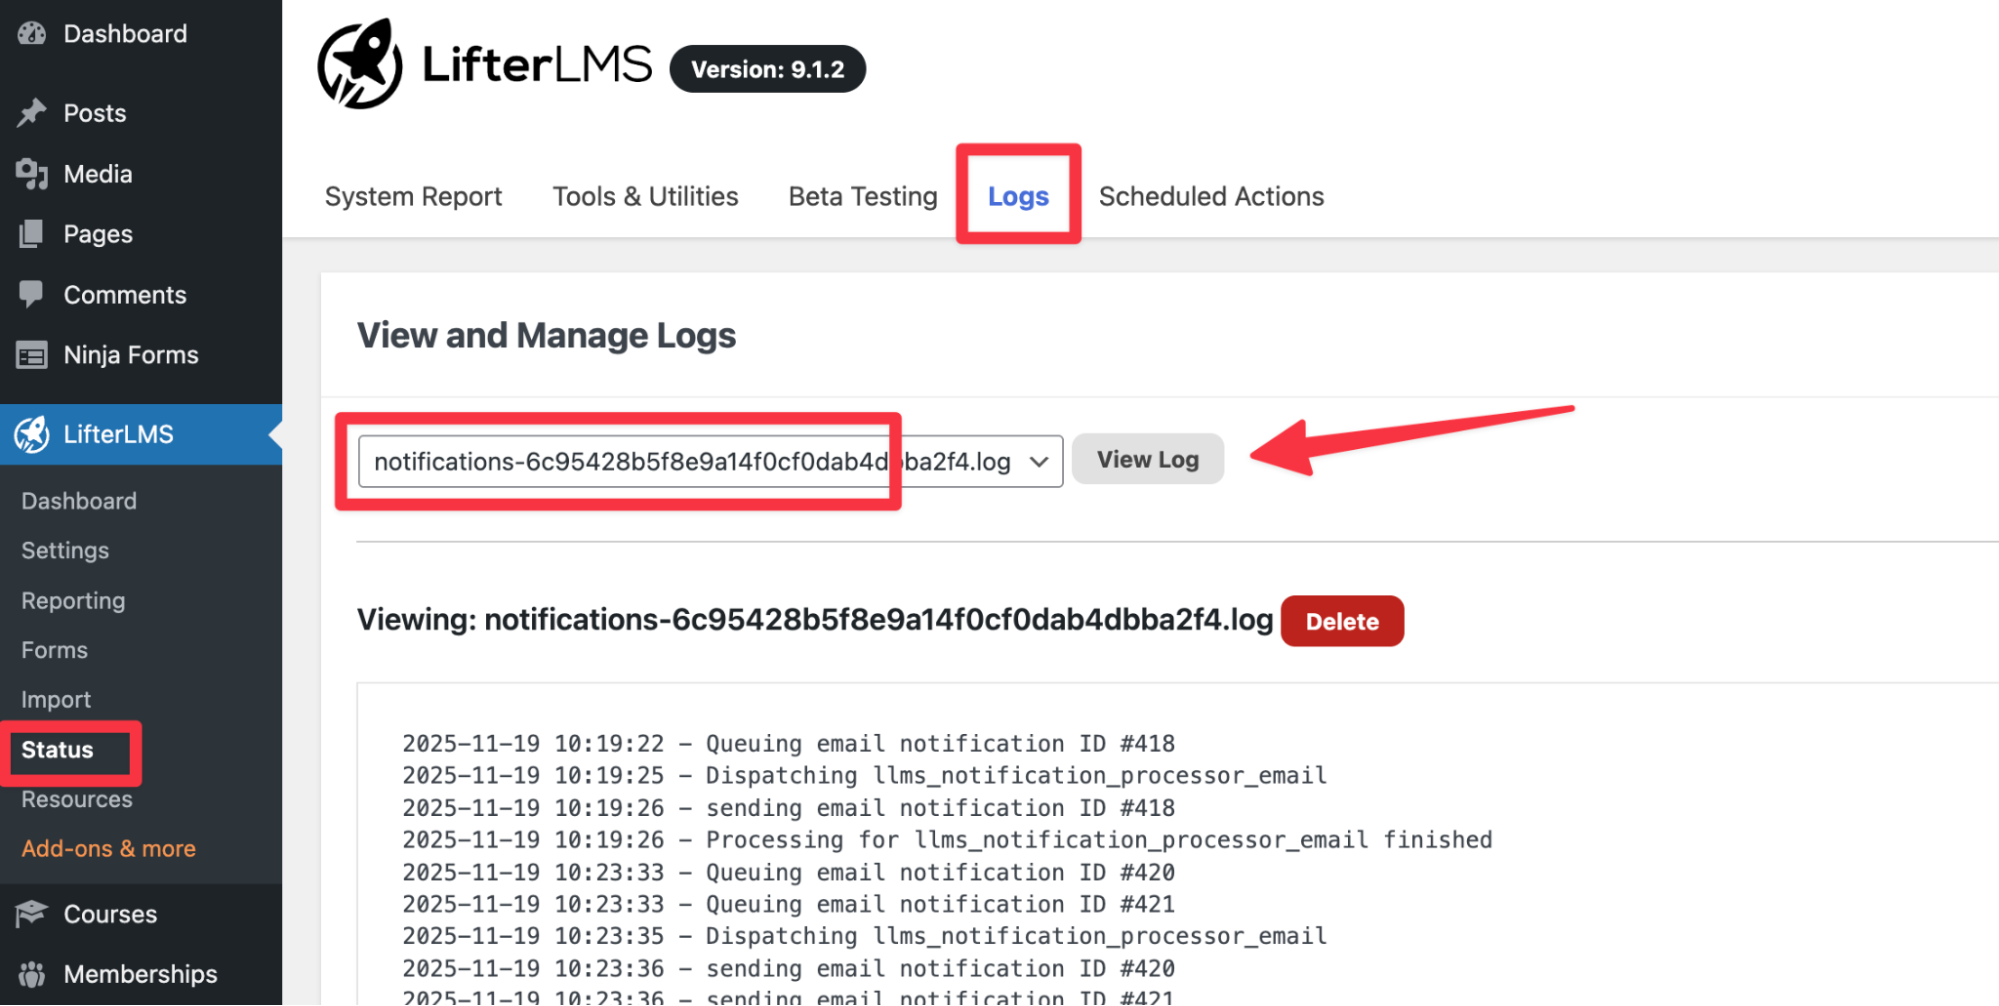
- Navigate to LifterLMS > Status.
- Click the “Logs” tab in the menu bar.
- You will see several log options listed in the dropdown; however, for common troubleshooting scenarios, select the “debug.log” option from the menu. The debug.log file is the one you’ll use in most support and troubleshooting cases. It records PHP warnings, notices, and fatal errors generated by WordPress, themes, and plugins, including LifterLMS.
- Click View to see the error details on your screen.
- To hunt down specific issues, press Ctrl + F (Windows) or Command + F (Mac) on your keyboard and search for “error” or “fatal error”.
Method B: View via FTP/File Manager (For White Screens)
If your site has a White Screen of Death and you can’t get into the dashboard, you can still access the debug log directly on your server, so you’re not blocked from finding the error.
- Open your FTP Client or Hosting File Manager.
- Navigate to the wp-content folder.
- Look for a file named debug.log.
- Open or download this file to view the contents.
- Scroll to the bottom of the file to see the most recent errors.
When you have identified the issue or sent the log file to support, disable debugging. Debugging should only be enabled while you’re troubleshooting, as leaving it on can slow your site and reveal technical details you don’t want displayed.
- Open wp-config.php again.
- Change true to false in the debug lines, or remove the code block you added entirely.
define( 'WP_DEBUG', false );
define( 'WP_DEBUG_LOG', false );
- Save the file. Changes to wp-config.php are applied immediately when you save the file.
If you’re unsure what the log messages mean or aren’t sure how to fix the issue, share the debug.log file with your hosting provider or the plugin or theme developer, who can help diagnose the problem.
- Turn on debugging in wp-config.php
- Trigger the error again so it is logged
- View the log in LifterLMS or directly on the server
- Turn debugging off when you’re done