
Report: Sales
The Sales report shows your sales data for a given time period. To view the Sales report, navigate to LifterLMS > Reporting from your WordPress dashboard, and click on Sales in the menu bar.
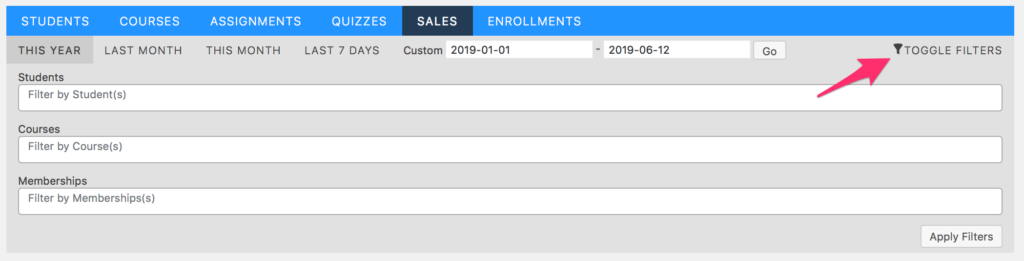
You can select the date range you’d like to run the report for at the top. Clicking on Toggle Filters will give you the option of filtering the Sales report by specific students, courses, or memberships.
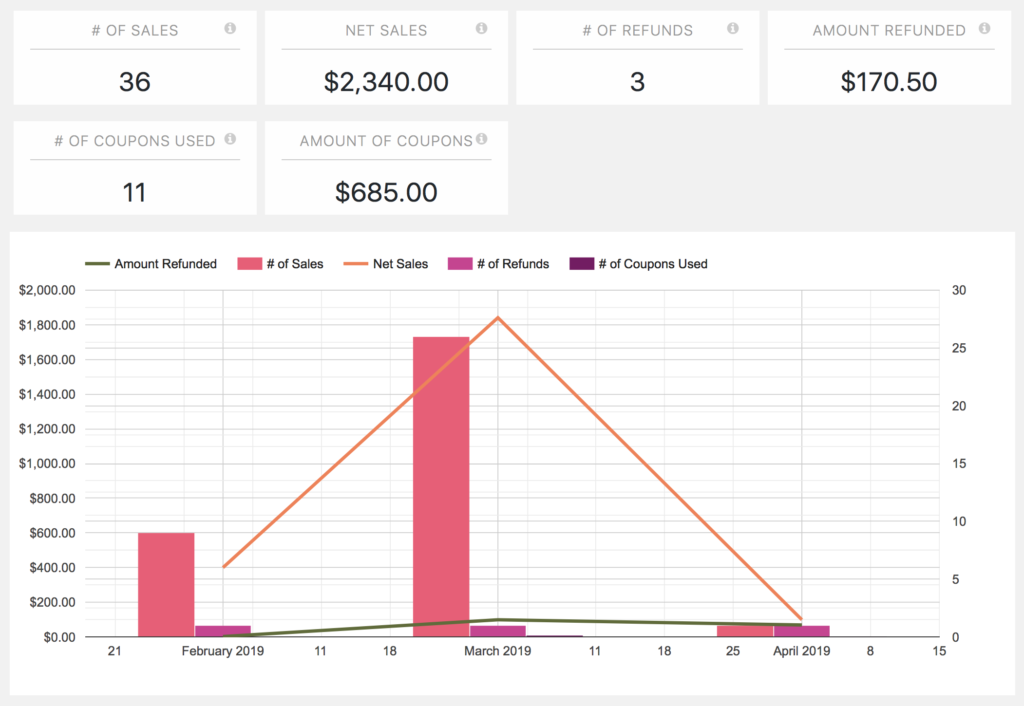
The Sales report detail shows the number of sales and net sales dollar amount, number of refunds and dollar amount refunded, number of coupons used and total dollar amount of the coupons used. The report also shows a graph of the sales data.